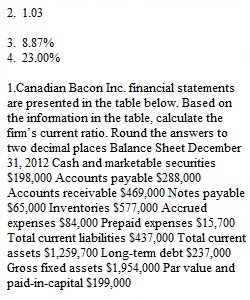
Q 1.Canadian Bacon Inc. financial statements are presented in the table below. Based on the information in the table, calculate the firm’s current ratio. Round the answers to two decimal places Balance Sheet December 31, 2012 Cash and marketable securities $198,000 Accounts payable $288,000 Accounts receivable $469,000 Notes payable $65,000 Inventories $577,000 Accrued expenses $84,000 Prepaid expenses $15,700 Total current liabilities $437,000 Total current assets $1,259,700 Long-term debt $237,000 Gross fixed assets $1,954,000 Par value and paid-in-capital $199,000 Less: accumulated depreciation $476,000 Retained Earnings $1,864,700 Net fixed assets $1,478,000 Common Equity 2,063,700 Total assets $2,737,700 Total liabilities and owner’s equity $2,737,700 Income Statement, Year of 2012 Net sales (all credit) $7,546,600.00 Less: Cost of goods sold $6,112,746.00 Selling and administrative expenses $349,000.00 Depreciation expense $145,000.00 EBIT $939,854.00 Interest expense $49,500.00 Earnings before taxes $890,354.00 Income taxes $356,141.60 Net income $534,212.40 2.Canadian Bacon Inc. financial statements are presented in the table below. Based on the information in the table, calculate the firm’s acid-test ratio (quick ratio). Round the answers to two decimal places Balance Sheet December 31, 2010 Cash and marketable securities $102,000 Accounts payable $287,000 Accounts receivable $299,000 Notes payable $61,200 Inventories $628,000 Accrued expenses $51,900 Prepaid expenses $10,300 Total current liabilities $400,100 Total current assets $1,039,300 Long-term debt $415,000 Gross fixed assets $1,502,000 Par value and paid-in-capital $376,000 Less: accumulated depreciation $312,000 Retained Earnings $1,038,200 Net fixed assets $1,190,000 Common Equity 1,414,200 Total assets $2,229,300 Total liabilities and owner’s equity $2,229,300 Income statement, Year of 2010 Net sales (all credit) $6,387,700.00 Less: Cost of goods sold $4,726,898.00 Selling and administrative expenses $345,000.00 Depreciation expense $148,000.00 EBIT $1,167,802.00 Interest expense $50,600.00 Earnings before taxes $1,117,202.00 Income taxes $446,880.80 Net income $670,321.20 3.Canadian Bacon Inc. financial statements are presented in the table below. Based on the information in the table, caluclate the firm’s the net-working capital – to-sales ratio. Round the answers to two decimal places in percentage form. (Write the percentage sign in the "units" box). Balance Sheet December 31, 2014 Cash and marketable securities $132,000 Accounts payable $399,000 Accounts receivable $311,000 Notes payable $98,500 Inventories $512,000 Accrued expenses $89,300 Prepaid expenses $11,300 Total current liabilities $586,800 Total current assets $966,300 Long-term debt $799,400 Gross fixed assets $2,104,000 Par value and paid-in-capital $298,000 Less: accumulated depreciation $398,000 Retained Earnings $988,100 Net fixed assets $1,706,000 Common Equity 1,286,100 Total assets $2,672,300 Total liabilities and owner’s equity $2,672,300 Income Statement, Year of 2014 Net sales (all credit) $4,276,600.00 Less: Cost of goods sold $3,292,982.00 Selling and administrative expenses $349,000.00 Depreciation expense $148,000.00 EBIT $486,618.00 Interest expense $49,600.00 Earnings before taxes $437,018.00 Income taxes $174,807.20 Net income $262,210.80 4. Canadian Bacon Inc. financial statements are presented in the table below. Based on the information in the table, calculate the firm’s gross profit margin. Round the answers to two decimal places in percentage form. (Write the percentage sign in the "units" box). Balance Sheet December 31, 2014 Cash and marketable securities $132,000 Accounts payable $399,000 Accounts receivable $311,000 Notes payable $98,500 Inventories $512,000 Accrued expenses $89,300 Prepaid expenses $11,300 Total current liabilities $586,800 Total current assets $966,300 Long-term debt $799,400 Gross fixed assets $2,104,000 Par value and paid-in-capital $298,000 Less: accumulated depreciation $398,000 Retained Earnings $988,100 Net fixed assets $1,706,000 Common Equity 1,286,100 Total assets $2,672,300 Total liabilities and owner’s equity $2,672,300 Income Statement, Year of 2014 Net sales (all credit) $4,276,600.00 Less: Cost of goods sold $3,292,982.00 Selling and administrative expenses $349,000.00 Depreciation expense $148,000.00 EBIT $486,618.00 Interest expense $49,600.00 Earnings before taxes $437,018.00 Income taxes $174,807.20 Net income $262,210.80 5. Canadian Bacon Inc. financial statements are presented in the table below. Based on the information in the table, calculate the firm’s the operating profit margin. Round the answers to two decimal places in percentage form. (Write the percentage sign in the "units" box). Balance Sheet December 31, 2014 Cash and marketable securities $132,000 Accounts payable $399,000 Accounts receivable $311,000 Notes payable $98,500 Inventories $512,000 Accrued expenses $89,300 Prepaid expenses $11,300 Total current liabilities $586,800 Total current assets $966,300 Long-term debt $799,400 Gross fixed assets $2,104,000 Par value and paid-in-capital $298,000 Less: accumulated depreciation $398,000 Retained Earnings $988,100 Net fixed assets $1,706,000 Common Equity 1,286,100 Total assets $2,672,300 Total liabilities and owner’s equity $2,672,300 Income Statement, Year of 2014 Net sales (all credit) $4,276,600.00 Less: Cost of goods sold $3,292,982.00 Selling and administrative expenses $349,000.00 Depreciation expense $148,000.00 EBIT $486,618.00 Interest expense $49,600.00 Earnings before taxes $437,018.00 Income taxes $174,807.20 Net income $262,210.80
View Related Questions